Projects
Independent products built over the past three months using product thinking, prompt+context engineering, and agent orchestration.
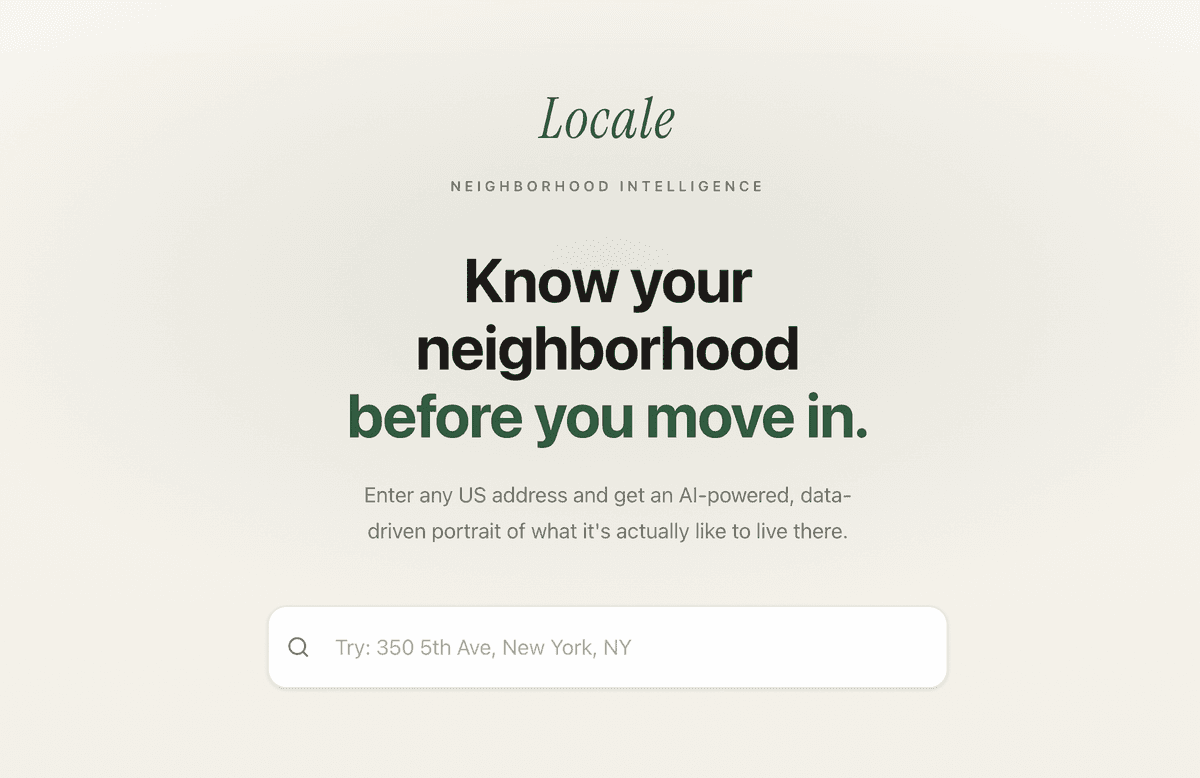
Locale
AI-powered neighborhood intelligence — enter any US street address and get a data-driven, editorially narrated report on what daily life actually feels like there, with interactive maps, archetype classification, and shareable URLs.
AI-native Product Engineer — product concept, data pipeline design, context engineering, AI agent orchestration, and full-stack implementation.
Live product transforming public data from three parallel APIs into AI-narrated neighborhood reports with interactive Mapbox maps, archetype classification, and OG-optimized shareable URLs. 223 tests passing.
The Problem
The data you need to understand a neighborhood already exists—Census demographics, housing costs, commute patterns, what’s within walking distance. But it’s scattered across government portals, real estate platforms, and map apps, none of which answer the question people actually ask: what does it feel like to live here?
Zillow optimizes for transactions, not neighborhoods. Google Maps shows what’s nearby but not what it means. Census.gov has the numbers but no interpretation. The gap between “median household income: $72,400” and “young families walk to the farmers market on Saturday mornings” is where real understanding lives—and that gap is currently filled only by word-of-mouth. As someone who moves around a lot, I wanted to build something I wish I had while house-hunting.
What It Does
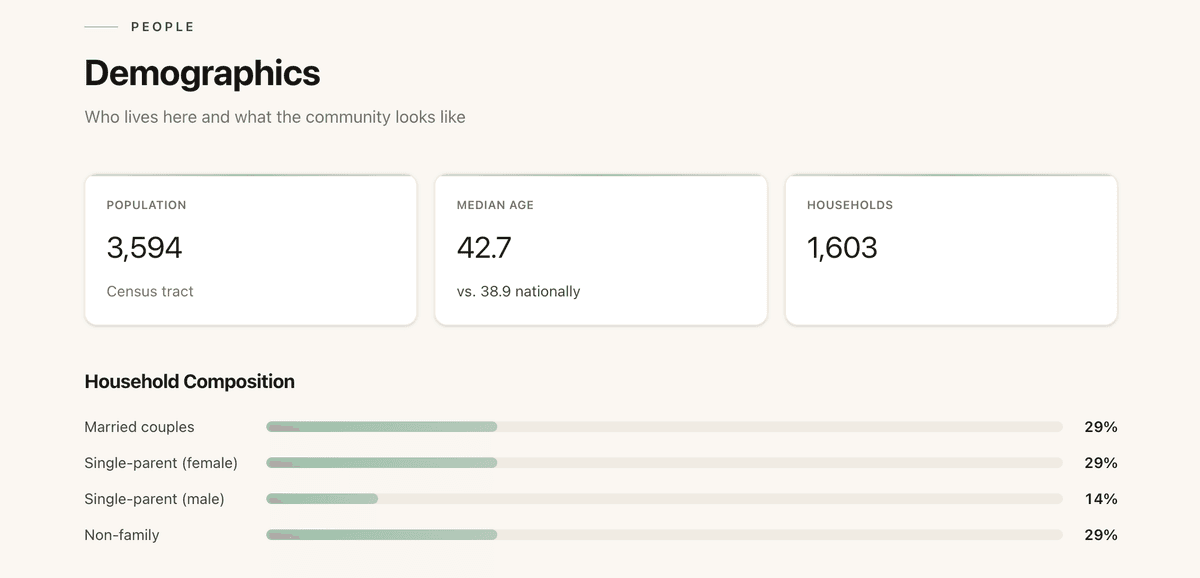
Enter any US street address. Locale pulls real data from three public sources in parallel: Census ACS for demographics, housing, and economic indicators; Mapbox for walking-distance isochrone analysis; OpenStreetMap for nearby points of interest across eight categories. Claude writes an editorial narrative about what daily life actually looks like there, grounded in the data, not hallucinated from training knowledge.
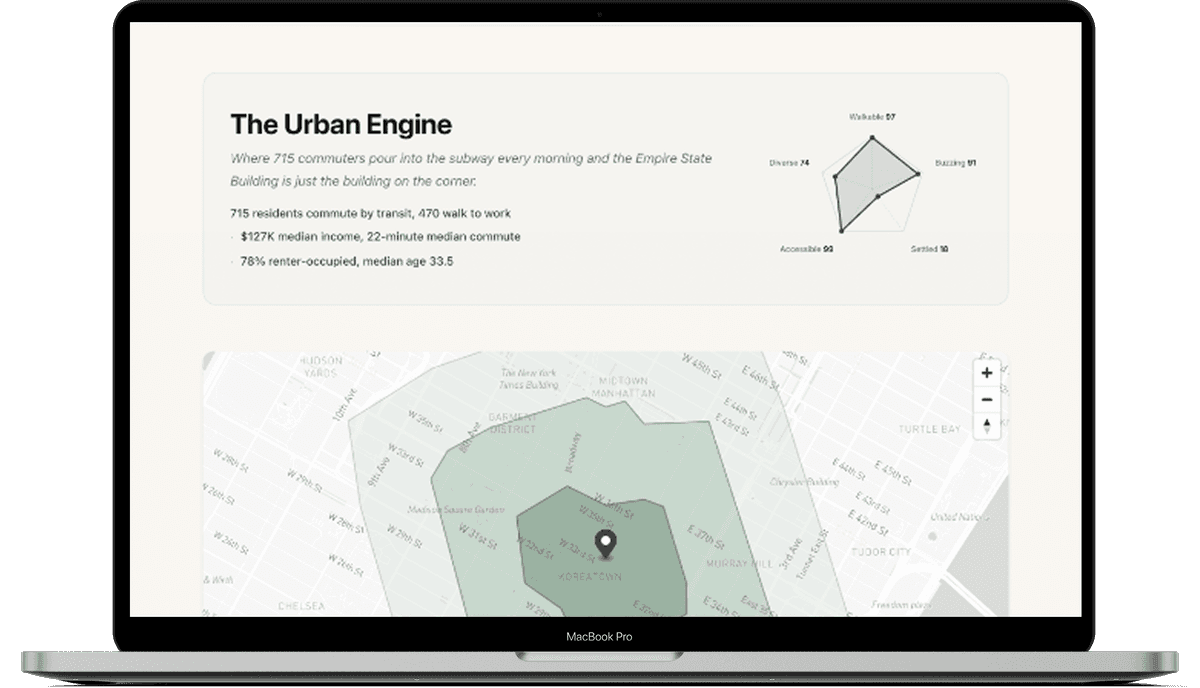
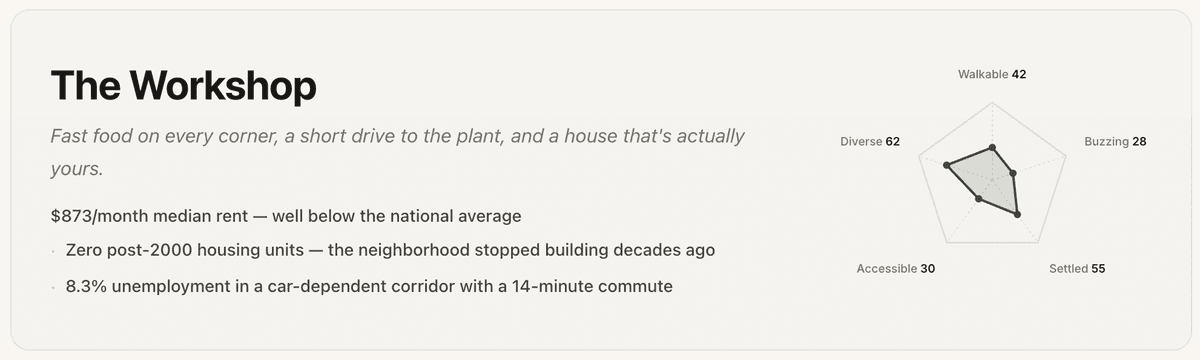
Each report includes five structured data sections, an interactive map with walking-distance isochrone rings and POI markers, and a neighborhood archetype classification (one of 16 personality types like “The Brownstone Belt” or “Campus Orbit”) with a five-axis vibe spectrum radar chart. The five axes—Walkable, Buzzing, Settled, Accessible, Diverse—are scored against real data, not inferred from training knowledge. A chatbot names a vibe; Locale measures it.
Every report gets a shareable URL with Open Graph previews. Data is frozen as a JSONB snapshot at generation time—shared links always render the exact data the narrative was written against.
Data Pipeline
Three independent API calls run in parallel via Promise.all:
- Census ACS 5-Year—demographics, housing, economics with national and city-level comparisons
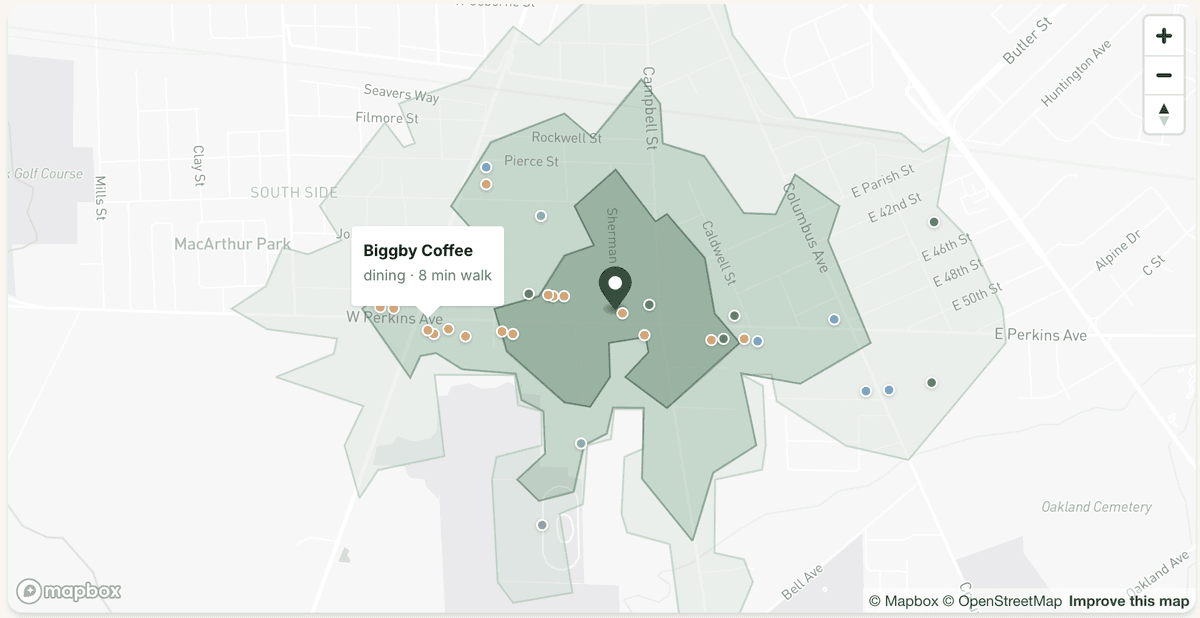
- Mapbox Isochrone—5/10/15-minute walking distance polygons rendered as map overlays
- Overpass API (OpenStreetMap)—nearby amenities across eight categories: dining, groceries, parks, fitness, nightlife, healthcare, shopping, education
Each source can fail independently. If Census is down, the report still shows walkability and amenities. The narrative adapts—it omits sections for missing data rather than fabricating.
Two separate Claude calls handle different concerns. Archetype classification runs at temperature 0.3 because it’s a categorization task. Narrative generation runs at 0.7—it needs room to write well. The archetype call fires first; its result can optionally inform the narrative, making them a coherent two-stage synthesis rather than two parallel outputs. A five-second timeout ensures a slow classification never delays the prose.
The narrative prompt bans a specific list of AI clichés—no “vibrant,” “bustling,” “hidden gem,” or “rich tapestry” (“vibrant” went first; it always does). It requires honest tradeoffs rather than real estate boosterism.
Architecture Decisions
- JSONB snapshots over live data: shared URLs render instantly from frozen data, and the narrative never drifts from the numbers it references. Tradeoff is stale data on old reports—acceptable for a point-in-time product.
- Insert-then-retry for slug uniqueness: eliminates the check-then-insert race condition. Up to three retries with a random suffix on collision.
- Custom walkability heuristic over Walk Score API: POI count plus category diversity mapped to A/B/C/D grades. Avoids third-party cost and keeps scoring logic under full control.
- Non-fatal archetype enrichment: separate AI call with independent failure mode. The classification prompt uses a curated seed catalog of 16 archetypes but allows the model to coin new labels if none fit—structured creativity over unconstrained generation. Failure returns null; the report renders without an archetype rather than with a bad one.
- Neon HTTP driver via Drizzle ORM: stateless serverless database access without platform lock-in. Lazy initialization prevents build-time errors when env vars are missing.
My Role
Every decision in Locale came back to the same question: what would make someone actually trust this report enough to use it when it matters?
- Product vision: identified the gap between raw census statistics and lived-experience understanding. Scoped a focused MVP that turns a single address input into a shareable, data-grounded neighborhood narrative.
- Data strategy: selected three complementary public APIs covering demographics, mobility, and amenities—no paywalls, no API key barriers for end users. Designed the parallel pipeline with independent failure paths so one slow or down source doesn’t block the report.
- Prompt architecture and evaluation: two-temperature AI pipeline. Tight classification for archetype consistency, open narrative for editorial quality. I noticed early that the generic AI-booster voice was the single fastest way to destroy trust—so I authored a banned-word list and required honest tradeoff language to counteract it. Validated archetype quality against a golden dataset of 20 addresses; consistency testing across five runs per address achieved 100% label consistency with spectrum variance under ±10 points.
- System design: JSONB snapshot model for link shareability, progressive rendering (map → data sections → streaming narrative), case-insensitive address caching to prevent duplicate reports, Satori-generated archetype cards as OG images—the report’s social preview is a designed artifact, not a map thumbnail.
- AI-native engineering: the entire codebase was built through agent orchestration—no direct code authorship. And I want to be clear: that’s the whole point. My contribution was upstream: product specs detailed enough for agents to implement without ambiguity, architectural decisions made in planning documents rather than pull requests, evaluation frameworks to validate what was built. The archetype feature spec alone covered 18 tasks across six phases with full dependency graphs and parallelism analysis.